The answer first
An unshaded south roof at 35° in Nantwich makes about 959 kWh a year for each kWp; the best case in our runs, south at 40°, makes 962. East and west roofs make about 80% and 79% of that, north about 54%. Shade from hedges, trees and neighbouring roofs comes off every figure.
Every direction and pitch
Each figure is the yearly output of 1 kWp at 53.067° N, 2.522° W, from PVGIS 5.3. Multiply by the size on a quote: 4 kWp on a south roof at 35° comes to about 3,838 kWh.
| Facing | 10° | 20° | 30° | 35° | 40° | 45° | 50° |
|---|---|---|---|---|---|---|---|
| South | 869 | 920 | 952 | 959 | 962 | 959 | 951 |
| South-east | 849 | 884 | 903 | 907 | 905 | 900 | 889 |
| South-west | 846 | 879 | 897 | 900 | 898 | 891 | 881 |
| East | 797 | 789 | 775 | 766 | 754 | 739 | 722 |
| West | 793 | 783 | 767 | 757 | 745 | 730 | 712 |
| North-east | 741 | 682 | 626 | 600 | 574 | 548 | 522 |
| North-west | 739 | 678 | 622 | 595 | 569 | 543 | 517 |
| North | 717 | 638 | 560 | 521 | 483 | 446 | 410 |
When the acceptable slope is not the best one
On a listed building, the council may accept panels on a rear slope that is hidden from the street and refuse them on a front slope that faces south. That trade-off is real in Nantwich’s centre, and the table puts a number on it. A rear slope facing east makes about 80% of the best figure; one facing north-east about 62%. Whether that is worth an application is a judgement for the owner, made with the figures in front of them. Listed buildings and the conservation area explain the planning side.
Frames in the garden
Village gardens often allow a frame that faces due south at whatever tilt suits, which a roof rarely does. At 30° to 40° facing south, output sits within a few per cent of the best case. The stand-alone rules limit the area to 9 m² without an application and set height limits, so a 9 m² frame holds a modest array: check the panel sizes on any quote against that area. Ground-mounted panels has the detail, and the rules themselves are in Part 14 of the permitted development order.
Month by month
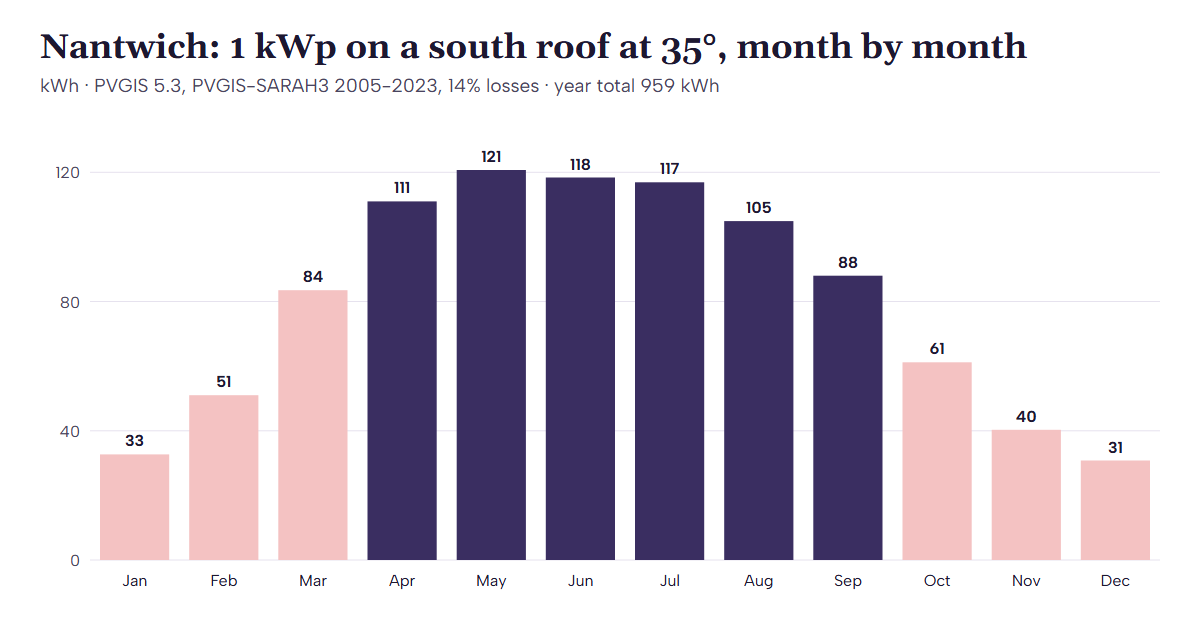
| Jan | Feb | Mar | Apr | May | Jun | Jul | Aug | Sep | Oct | Nov | Dec |
|---|---|---|---|---|---|---|---|---|---|---|---|
| 33 | 51 | 84 | 111 | 121 | 118 | 117 | 105 | 88 | 61 | 40 | 31 |
April to September brings 69% of the year’s output. For an oil-heated house that is the season when the boiler is mostly heating water, which is why a hot-water diverter is often the first thing to ask about: see off-gas villages and export and self-use.
What the model does with Nantwich’s sunlight
PVGIS works out the sunlight first and the losses second. A south slope at 35° here receives about 1,183 kWh per square metre in an average year of 2005-2023, the most of the six Cheshire towns in this series (PVGIS 5.3). With panels rated at a kilowatt per square metre of sunshine, 1 kWp would turn all of that into electricity if nothing were lost. The model takes away 3.2% for sunlight glancing off the glass at low angles and 4.2% because hot panels and dim light convert less well, gives 1.7% back because the local daylight suits the cells, and removes the 14% allowance for cables, the inverter and dirt. That is 18.9% in all, leaving the 959 kWh shown in the table.
Year-to-year swings
A sunnier town is not a steadier one. PVGIS gives Nantwich a year-to-year standard deviation of about 30 kWh per kWp, so a 4 kWp array that averages 3,838 kWh might make around 119 kWh more or less in a given year. Most of that comes from spring and summer: April and July each vary by about 15 kWh per kWp, while December varies by about 6.
Setting the angle of a frame
A roof comes with its pitch; a frame does not. For a south-facing panel in Nantwich the model’s own best tilt is 40°, making 962 kWh per kWp, only 3 more than at 35°. In practice a frame’s height, the view from neighbouring gardens and the stand-alone limits matter more than the last degree of tilt, and anything from 30° to 45° is close to the best. Ground-mounted panels sets out those limits, and off-gas villages covers the houses with the gardens to take one.
Three numbers to have ready
Before asking for quotes, note the direction of each slope you might use, its pitch if you can measure it, and roughly how many panels it could hold. With those, the table gives a fair idea of the yearly output, and the cost page gives what households in the North West paid per kW, so you can tell whether a quote is in the right range before anyone climbs a ladder.
Nantwich against nearby towns
| Town | kWh per kWp |
|---|---|
| Nantwich | 959 |
| Winsford | 954 |
| Crewe | 951 |
| Frodsham | 941 |
| Northwich | 939 |
| Congleton | 909 |
Nantwich comes out top of the six, but by little: the spread from Nantwich to Northwich is about 2%. Congleton, near the Pennine edge, is lower.
Checking a quote
An MCS-certified firm must give a performance estimate for your roof (MCS). Find your direction and pitch above, multiply by the system size and compare. What the units are worth depends on how many you use at home and on export tariffs under the SEG rules. The route finder does the multiplication, and choosing an installer covers the paperwork.