The answer first
In Nantwich North and West, 23.9% of homes are flats and 11.7% heat with electricity alone. In Nantwich South and Stapeley, 39.5% are detached. In Audlem, 60.9% heat with oil or LPG only and 9.6% with mains gas only. Across Cheshire East, 76.9% use mains gas alone.
Building type
| Ward | Households | Detached | Semi | Terraced | Flat |
|---|---|---|---|---|---|
| Nantwich North and West | 4,256 | 16.6% | 31.3% | 28.2% | 23.9% |
| Nantwich South and Stapeley | 4,209 | 39.5% | 23.9% | 22.5% | 14.1% |
| Audlem | 2,287 | 59.9% | 25.5% | 9.3% | 2.8% |
| Wrenbury | 2,321 | 52.2% | 33.3% | 9.6% | 3.2% |
| Bunbury | 2,333 | 49.9% | 31.8% | 11.1% | 3.2% |
| Wybunbury | 2,302 | 65.9% | 23.3% | 8.1% | 2.5% |
| Cheshire East | 174,854 | 36.6% | 32.5% | 20.0% | 10.5% |
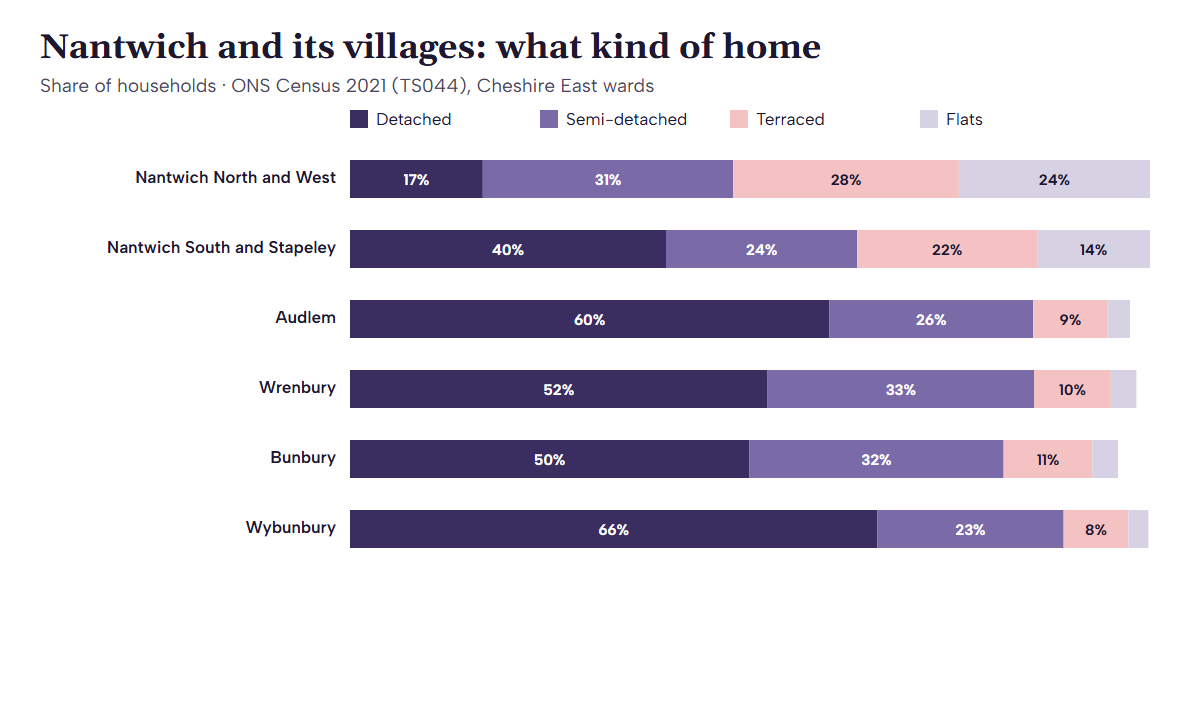
The two town wards split cleanly. North and west of the centre, terraces and flats make up more than half of homes; south and east, around Stapeley, detached houses lead. In every village ward about half of households or more live in detached houses, which usually means more roof to choose from and room in the garden: see ground-mounted panels. Flats bring a building owner and a lease into the decision: flats and solar.
How homes are heated
| Ward | Mains gas | Oil | LPG | Electric |
|---|---|---|---|---|
| Nantwich North and West | 77.0% | 0.6% | 0.2% | 11.7% |
| Nantwich South and Stapeley | 83.9% | 1.2% | 0.5% | 5.6% |
| Audlem | 9.6% | 45.7% | 15.2% | 6.9% |
| Wrenbury | 22.0% | 40.6% | 9.0% | 6.4% |
| Bunbury | 22.3% | 34.0% | 16.7% | 7.1% |
| Wybunbury | 65.7% | 13.1% | 4.0% | 3.0% |
| Cheshire East | 76.9% | 4.3% | 1.7% | 5.6% |
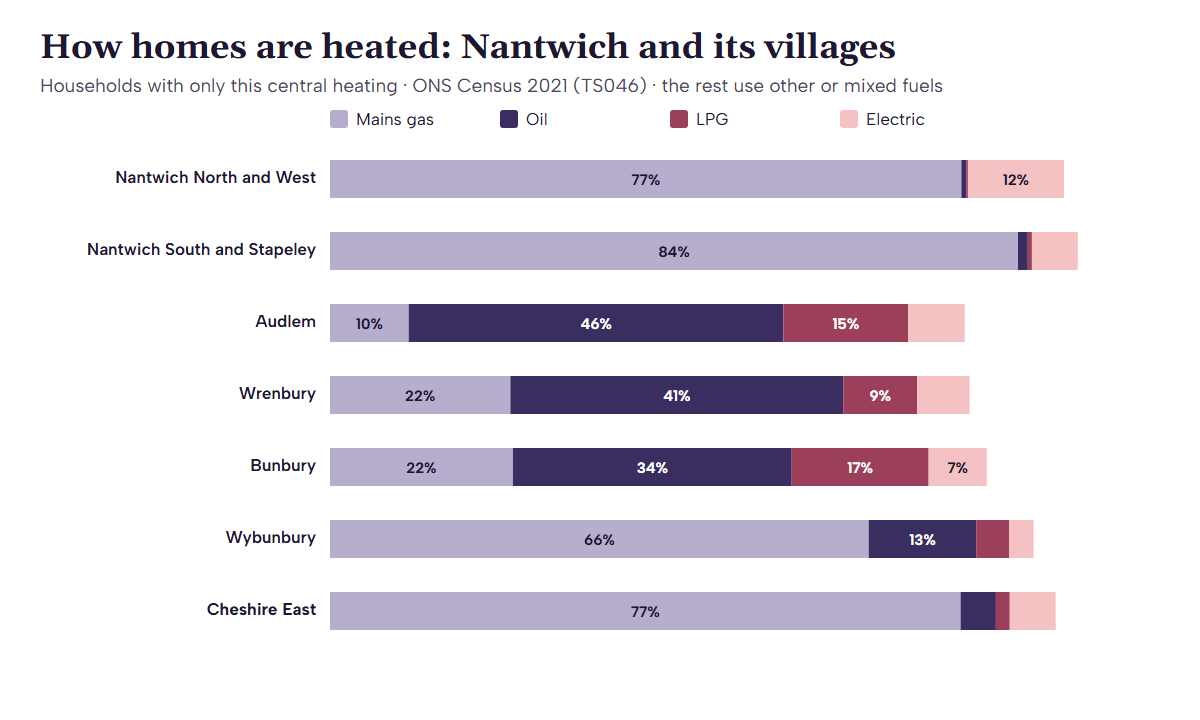
This is the sharpest difference on the page. In the town, mains gas heats most homes. In Audlem, Wrenbury and Bunbury, oil or bottled gas alone heats roughly half of households or more. Solar does different jobs in those homes: it cannot run an oil boiler, but it can heat water through a diverter and supply a heat pump if the heating changes. Off-gas villages and solar works through it.
Electric-only heating is highest in Nantwich North and West, at 11.7%, more than twice the borough’s 5.6%. That usually means storage heaters, which charge at night when panels are idle; batteries covers the timing problem.
Who owns and who rents
| Ward | Owned | Owned outright | Private rent | Social rent |
|---|---|---|---|---|
| Nantwich North and West | 61.8% | 38.7% | 17.2% | 20.0% |
| Nantwich South and Stapeley | 73.4% | 39.8% | 20.0% | 5.2% |
| Audlem | 82.0% | 53.4% | 10.1% | 6.9% |
| Wrenbury | 73.5% | 42.5% | 14.6% | 9.4% |
| Bunbury | 78.4% | 43.9% | 11.9% | 8.2% |
| Wybunbury | 84.8% | 44.5% | 12.2% | 2.6% |
| Cheshire East | 71.9% | 39.6% | 15.5% | 11.6% |
Village households are mostly owner-occupiers, and in Audlem more than half own outright. In the town, one household in five rents privately in Nantwich South and Stapeley. Where a home is let, the landlord decides about panels: renters and landlords.
The figures come from the Census 2021 releases on Nomis; the method is on data and sources, and the route finder takes your own building.